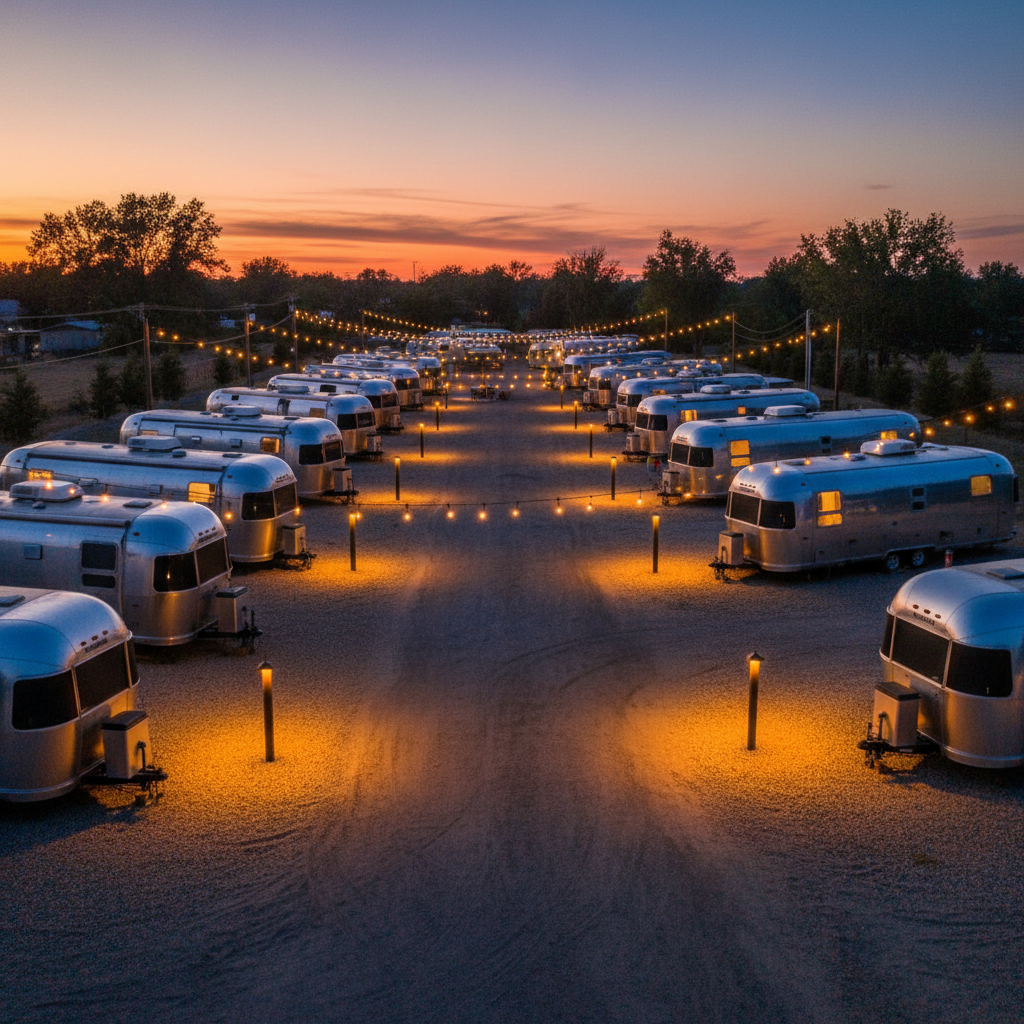
Own the GroundBeneath EveryRoad Trip.
Turnkey RV parks planted along America's most driven corridors — gravel leveled, hookups buried, playbook delivered. You collect nightly fees while families pull off the interstate.
Franchise vs. Going Alone
The data from 180+ sites built across 22 states. Every number below is audited operator average — not a best-case projection.
Build-Out Cost
Franchise WinsDays to First Booking
Franchise WinsYear 1 Occupancy
Franchise WinsRepeat Guest Rate
Franchise WinsYr 3 Cash Flow
Franchise Wins* Based on 2022–2025 operator data. Individual results vary. Full methodology in FDD.
Where does your capital work hardest?
RV parks occupy a rare quadrant: high cash yield, moderate entry cost, and management that scales down to one part-time hire after year one.
Avg. Annual ROI
22%
Basecamp operator avg.
Cash-on-Cash Yield
14.8%
Net of all fees
Time to Breakeven
3.1 yrs
At standard occupancy
Operators Since 2019
180+
Across 22 states
5-Year Average Annual Return
Source: Industry aggregates, 2020–2025Pick your footprint, unlock the playbook.
Three sizes, one system. Every tier ships with the same brand, booking engine, and operator training — only the acreage and income ceiling changes.
30 Sites · 3–5 acres
Starter
Total Investment
$285K–$420K
Build Time
75–90 days
Occupancy Target
68%
Projected Annual Cash Flow
$82K–$110K/yr
60 Sites · 6–10 acres
Standard
Total Investment
$520K–$740K
Build Time
90–120 days
Occupancy Target
76%
Projected Annual Cash Flow
$162K–$220K/yr
100 Sites · 12–20 acres
Flagship
Total Investment
$900K–$1.3M
Build Time
120–150 days
Occupancy Target
84%
Projected Annual Cash Flow
$290K–$380K/yr
Three paths in. One destination.
Pick the path that fits where you are today. Every conversation starts with data, not a pitch.
Request the FDD
No obligation. Full disclosure document delivered to your inbox — including territory exclusivity maps and operator P&Ls.